
A new peer reviewed study confirms that leakages from natural gas infrastructure significantly drive up the industry’s greenhouse emissions.
were measured at 417 parts per million , making it 217x more abundant than methane in the atmosphere. Although methane does not usually get the same bad rap that carbon dioxide does, it’s actually a far more potent greenhouse gas, over than CO2 over 20 years and 28x more powerful on a 100-year timescale.
About 40% of the earth’s methane is thought to come from natural sources including wetlands and bogs. Many microbes that thrive in oxygen-deprived ecosystems like waterlogged wetland soils spew out methane instead of CO2, which leaks directly into the atmosphere. Some methane also seeps out of the ground in areas with high volcanic activity as well as naturally near some oil and gas deposits.
Cows and other grazing animals host trillions of gut-filling hitchhikers that help them break down tough grasses to access the nutrients. These anaerobic microbes account for about a quarter of the world’s annual methane budget. Other agricultural endeavors such as rice paddies, landfills and sewage treatment centers also produce significant amounts of methane.
Hitherto, most industries have estimated greenhouse gas emission by largely relying on paper-based calculations of what’s pouring out of smokestacks and tailpipes, as well as based on the amount of energy consumed by end users. But improvements in satellite technology are allowing researchers to actually stress test the data--and so far it’s revealing that oil and gas companies are more culpable than we thought.
Belgique Dernières Nouvelles, Belgique Actualités
Similar News:Vous pouvez également lire des articles d'actualité similaires à celui-ci que nous avons collectés auprès d'autres sources d'information.
 ChatGPT can match the top 1% of creative human thinkers, says new study“We had all been exploring with ChatGPT, and we noticed it had been doing some interesting things that we didn’t expect,” the study's author said.
Lire la suite »
 Global burden of diabetes: new study reveals alarming prevalence and projections for 2050Global burden of diabetes: new study reveals alarming prevalence and projections for 2050 TheLancet diabetes global burden globalburden publichealth globalpublichealth T1D T2D
Lire la suite »
 Trouble for Full-Time In-Office CompaniesA new study shows that companies allowing flexible working arrangements are growing faster than those without.
Lire la suite »
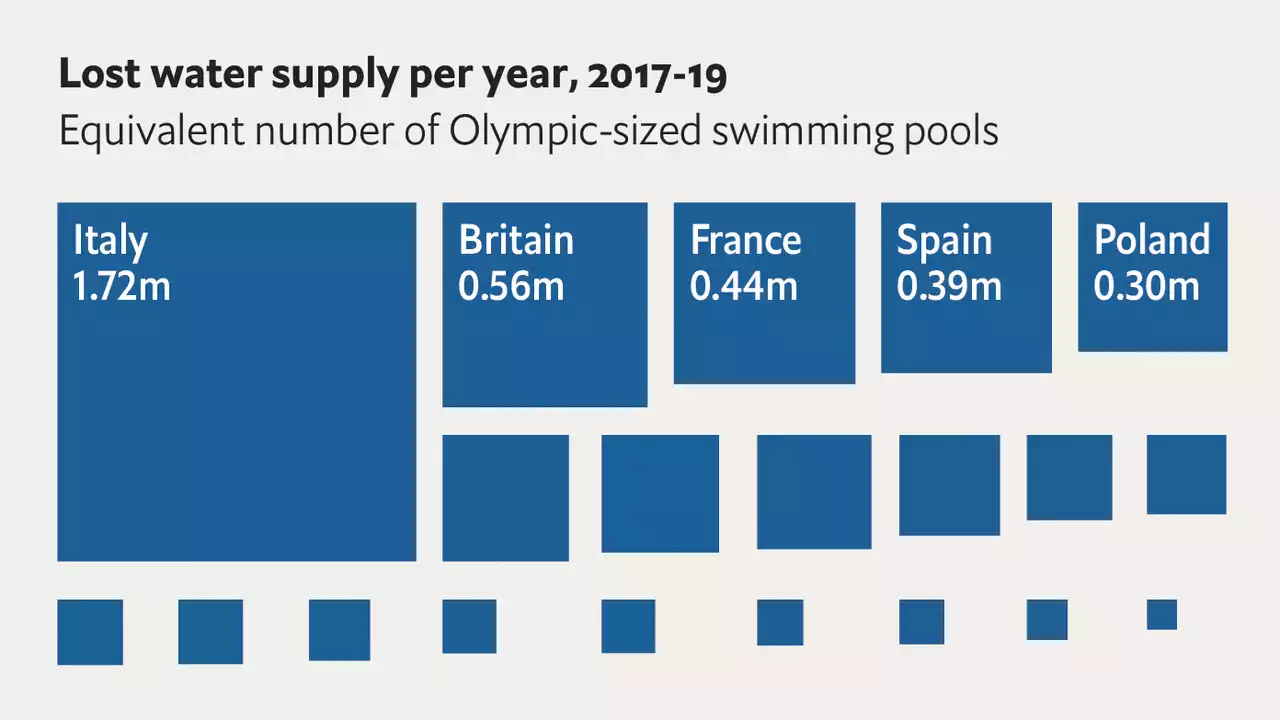 In drought-stricken Europe, leaky pipes are worsening the problemItaly is the region’s worst offender by volume, losing over three times as much water as Britain does (and 41% of all of its piped water). Ireland and Bulgaria lose more than half of their supply
Lire la suite »
 New UK passport change to hit travellers this week as new design unveiledPassports were issued by Her Majesty Queen Elizabeth for 70 years, but they are set to be changed this week.
Lire la suite »
 Fish intake and pre-frailty in Norwegian older adults - a prospective cohort study: the Tromsø Study 1994–2016 - BMC GeriatricsBackground Pre-frailty is an intermediate, potentially reversible state before the onset of frailty. Healthy dietary choices may prevent pre-frailty. Fish is included in most healthy diets, but little is known about the association between long-term habitual fish intake and pre-frailty. We aimed to elucidate the longitudinal association between the frequency of fish intake and pre-frailty in a cohort of older adults in Norway. Methods 4350 participants (52% women, ≥65 years at follow-up) were included in this prospective cohort study. Data was obtained from three waves of the population-based Tromsø Study in Norway; Tromsø4 (1994–1995), Tromsø6 (2007–2008) and Tromsø7 (follow-up, 2015–2016). Frailty status at follow-up was defined by a modified version of Fried’s phenotype. Fish intake was self-reported in the three surveys and assessed as three levels of frequency of intake: low (0–3 times/month), medium (1–3 times/week) and high (≥ 4 times/week). The fish–pre-frailty association was analysed using multivariable logistic regression in two ways; (1) frequency of intake of lean, fatty and total fish in Tromsø6 and pre-frailty at follow-up, and (2) patterns of total fish intake across the three surveys and pre-frailty at follow-up. Results At follow-up, 28% (n = 1124) were pre-frail. Participants with a higher frequency of lean, fatty and total fish intake had 28% (odds ratio (OR) = 0.72, 95% confidence interval (CI) = 0.53, 0.97), 37% (OR = 0.63, 95% CI = 0.43, 0.91) and 31% (OR = 0.69, 95% CI = 0.52, 0.91) lower odds of pre-frailty 8 years later compared with those with a low intake, respectively. A pattern of stable high fish intake over 21 years was associated with 41% (OR = 0.59, 95% CI = 0.38, 0.91) lower odds of pre-frailty compared with a stable low intake. Conclusions A higher frequency of intake of lean, fatty and total fish, and a pattern of consistent frequent fish intake over time, were associated with lower odds of pre-frailty in older community-dwelling
Lire la suite »